How to Read Candlestick Charts?
Canborsa Team
Candlestick charts are the universal language of trading. Every professional trader, whether they trade stocks on Wall Street, forex in London, or tokenized RWA tokens on Canborsa, reads the same charts using the same visual vocabulary. This article teaches you that language from the ground up.
Why candlesticks, not line charts?
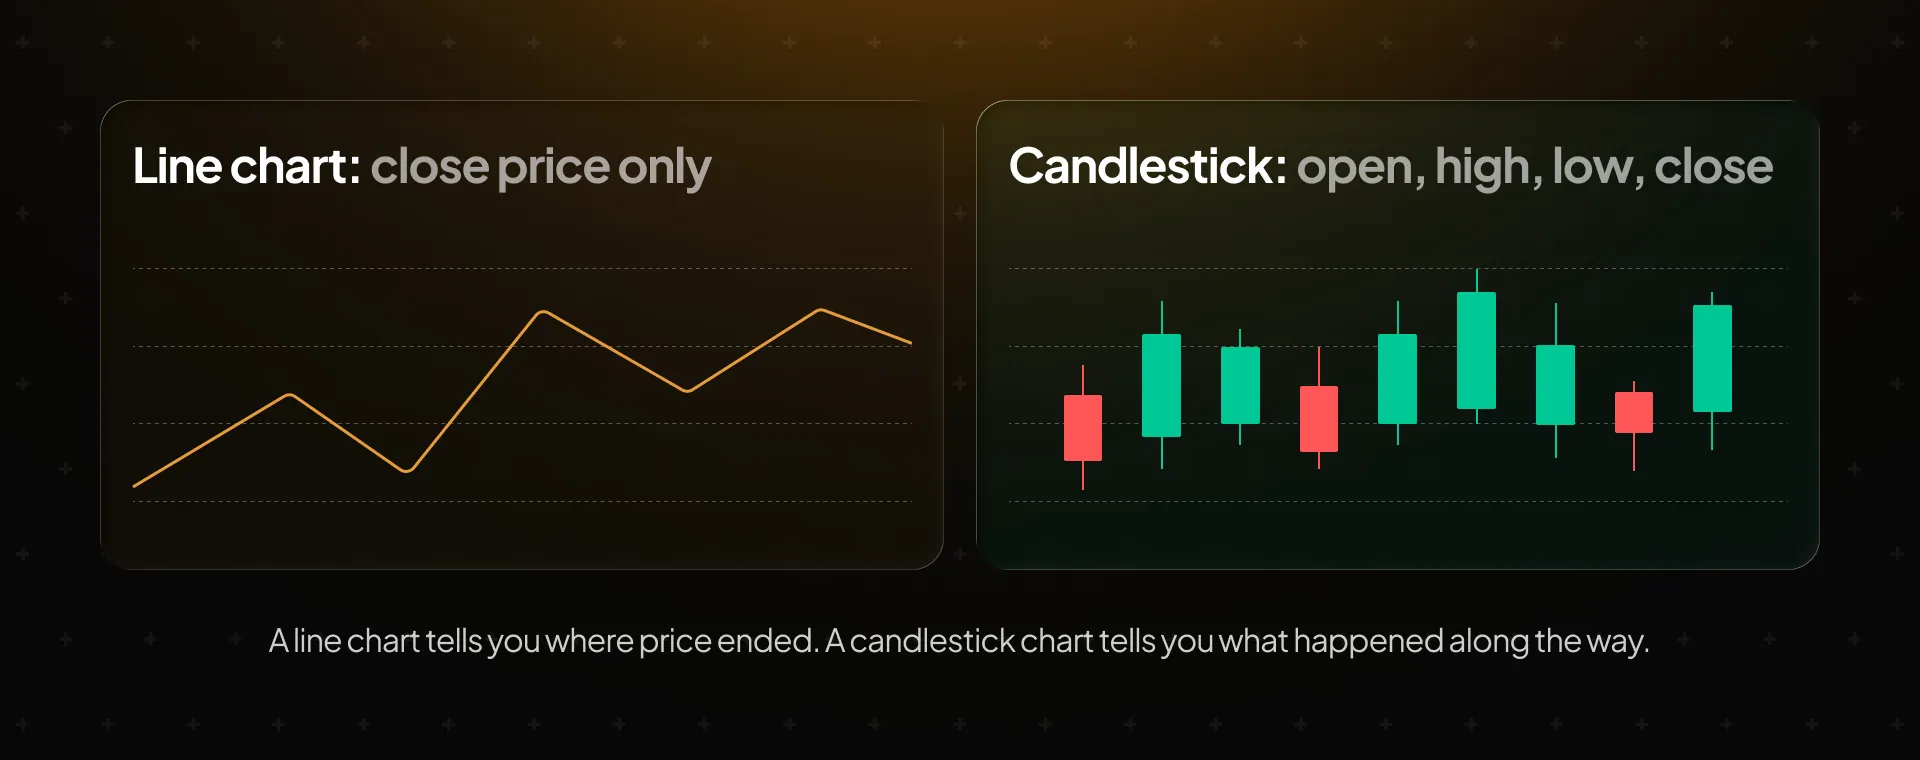
A simple line chart only shows closing prices connected by a line. It tells you where the price ended, nothing more. A candlestick chart shows you four things for every single time period: where the price opened, where it closed, how high it reached, and how low it fell.
That extra information changes everything. The distance between open and close tells you how decisive buyers or sellers were. The wicks above and below tell you where the price tried to go but failed. Every candle is a complete story of the battle between buyers and sellers in that period.
Anatomy of a single candlestick
Every candlestick has the same structure. Once you understand one candle, you can read any chart on any market in the world.
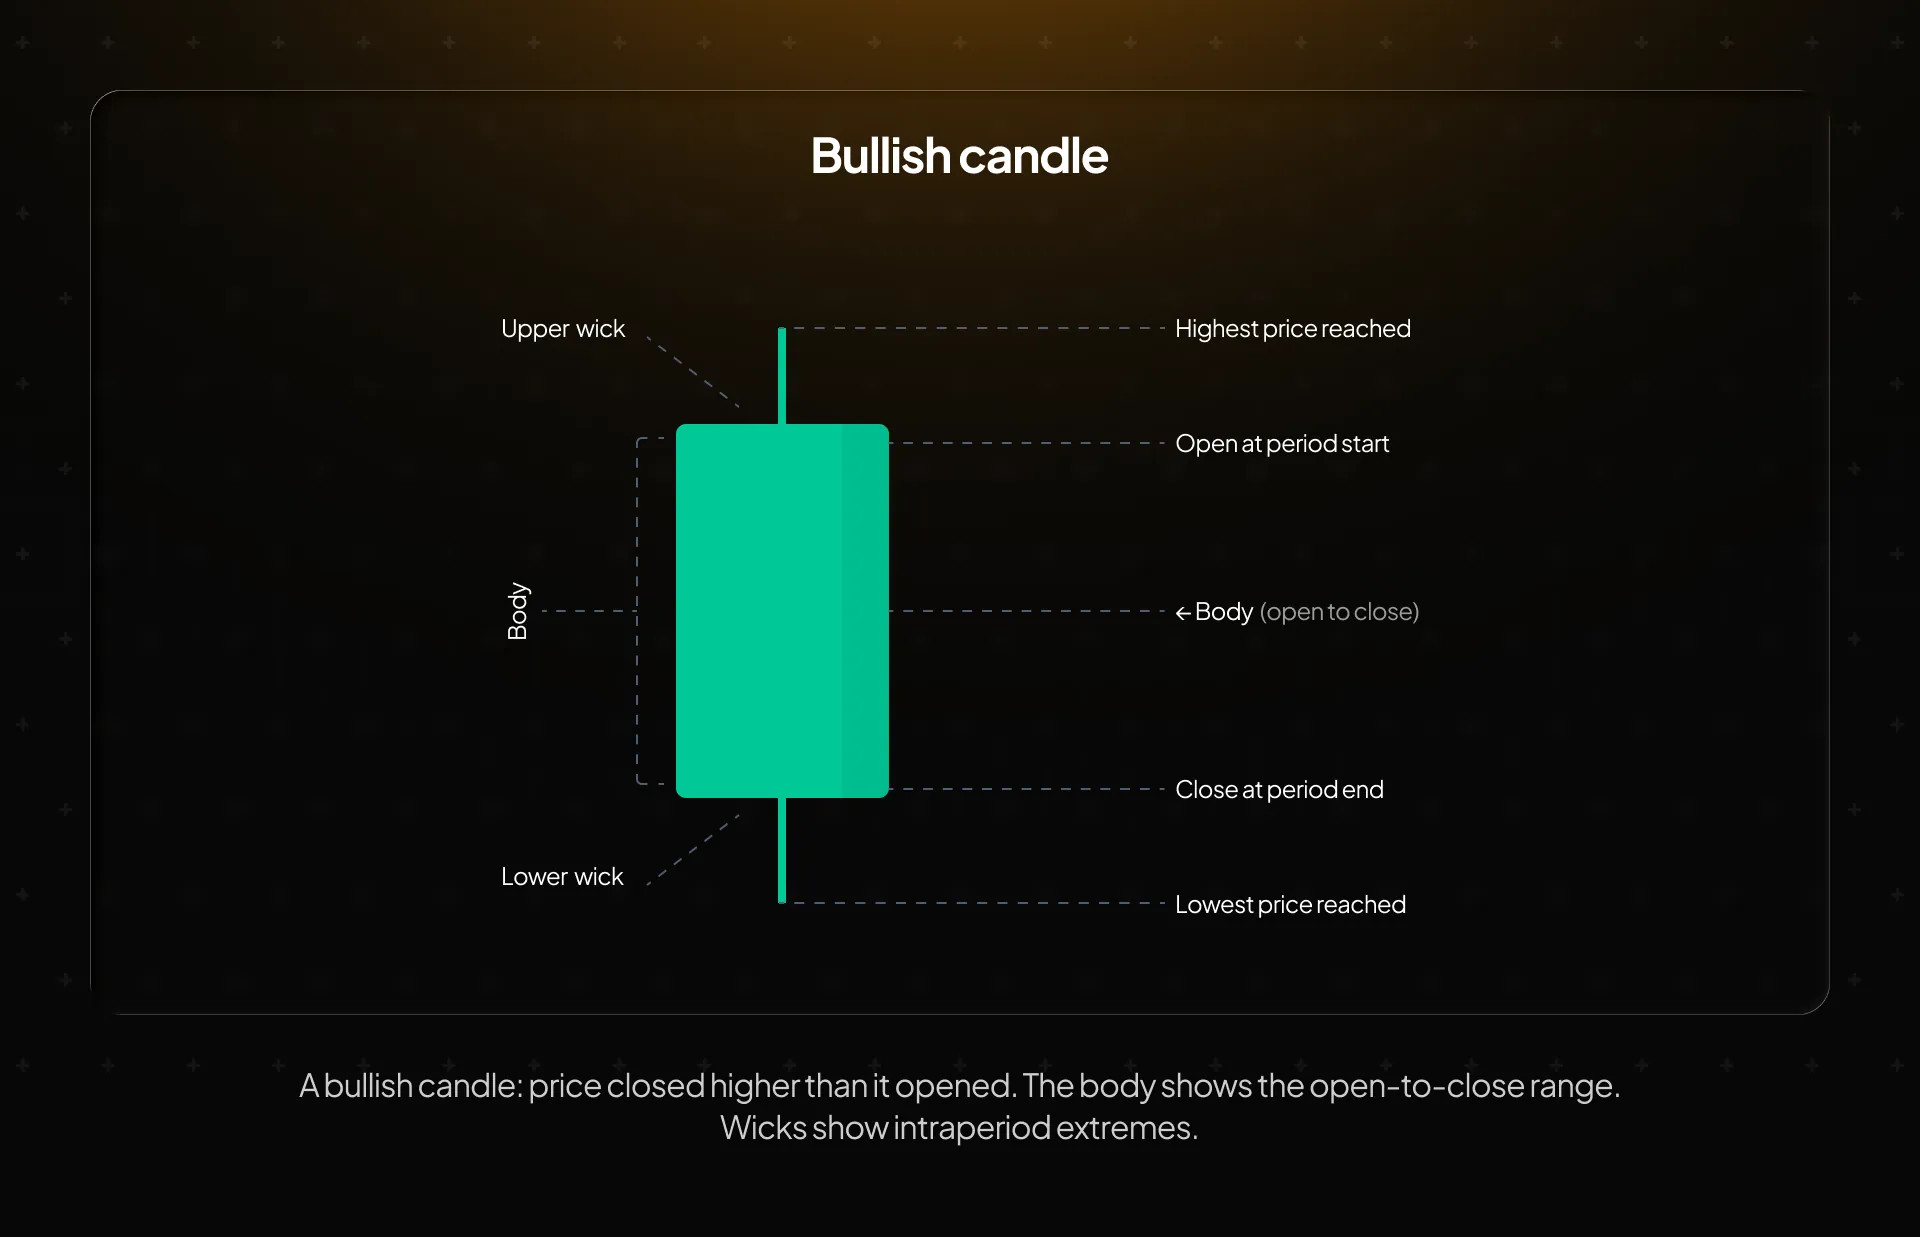
Bullish candle (green): close is higher than open. Buyers were in control during this period. The bigger the body, the stronger the buying pressure.
Bearish candle (red): close is lower than open. Sellers were in control during this period. The bigger the body, the stronger the selling pressure.
What the wicks tell you
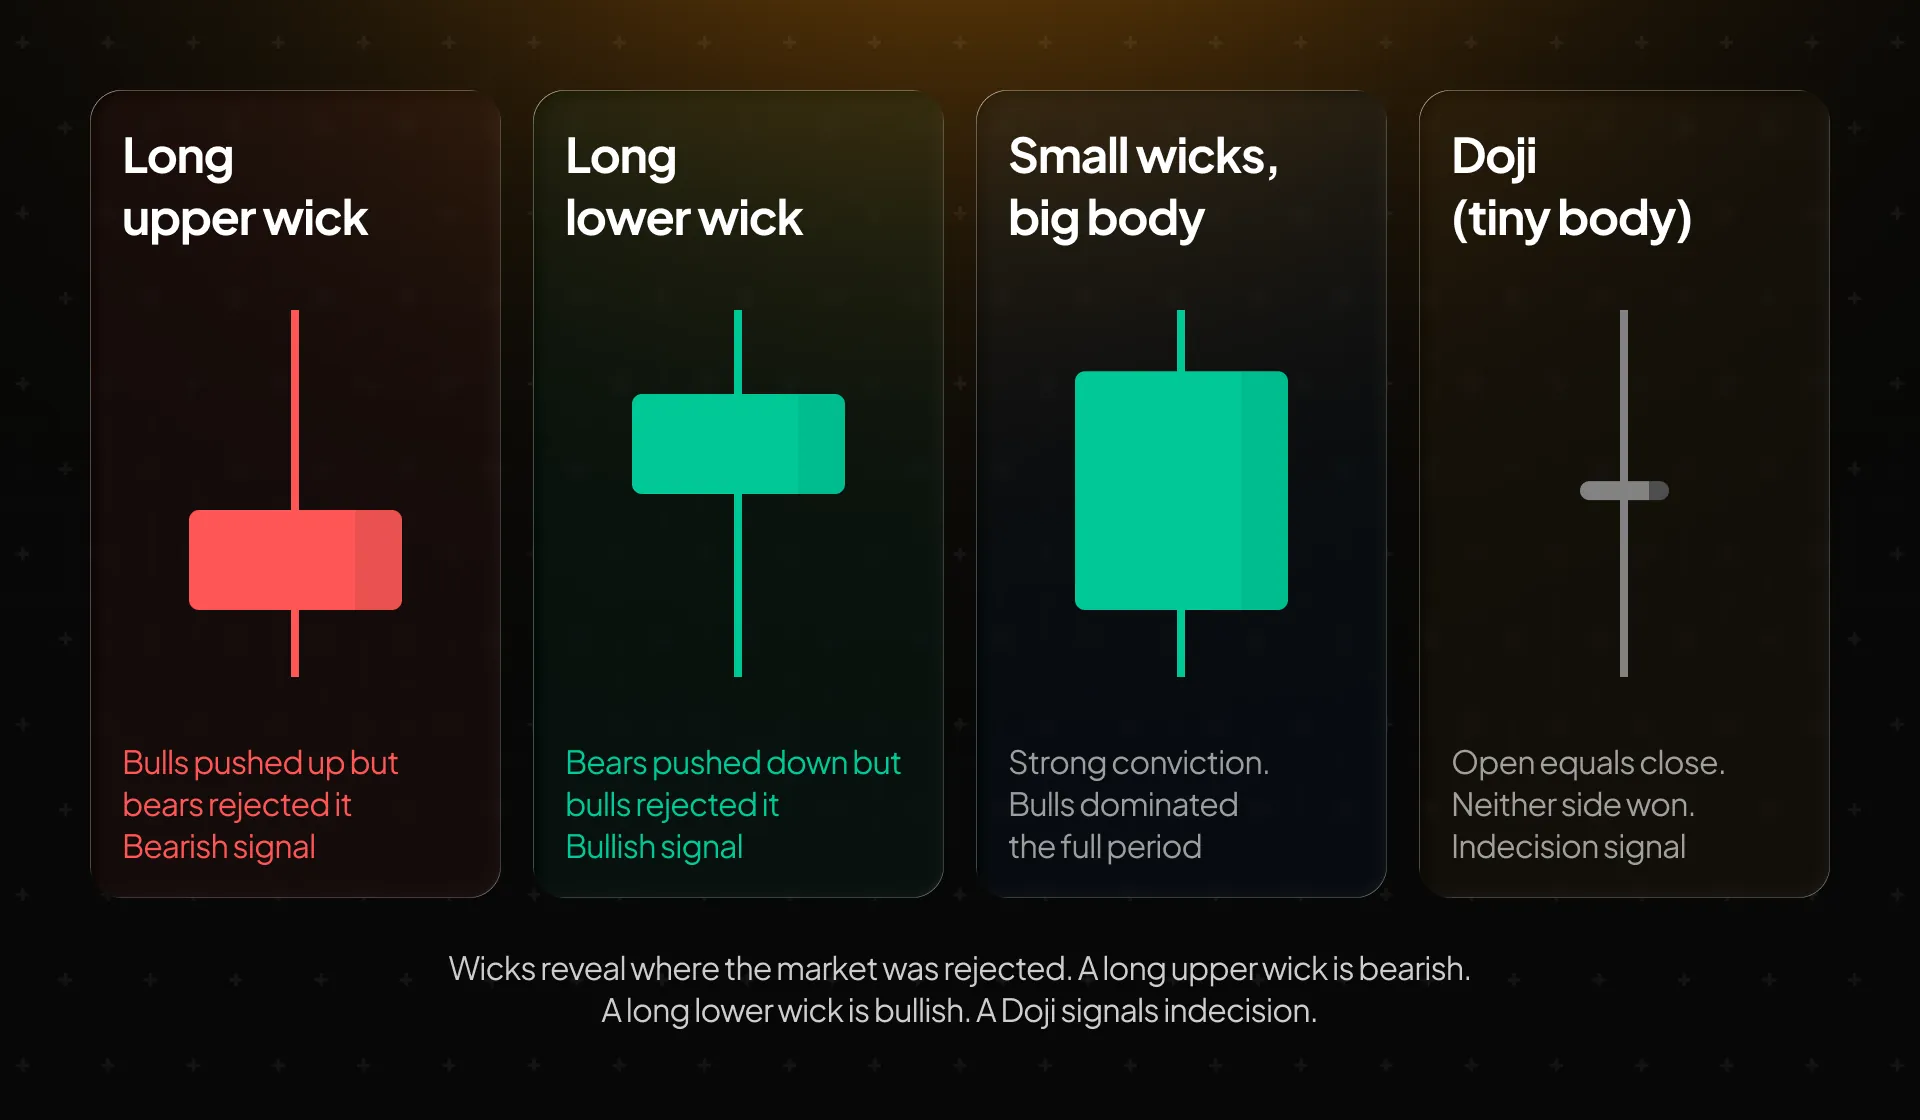
New traders focus on the body of the candle. Experienced traders pay just as much attention to the wicks. Wicks reveal where the market tried to go and was rejected. They show where the real fights between buyers and sellers happened.
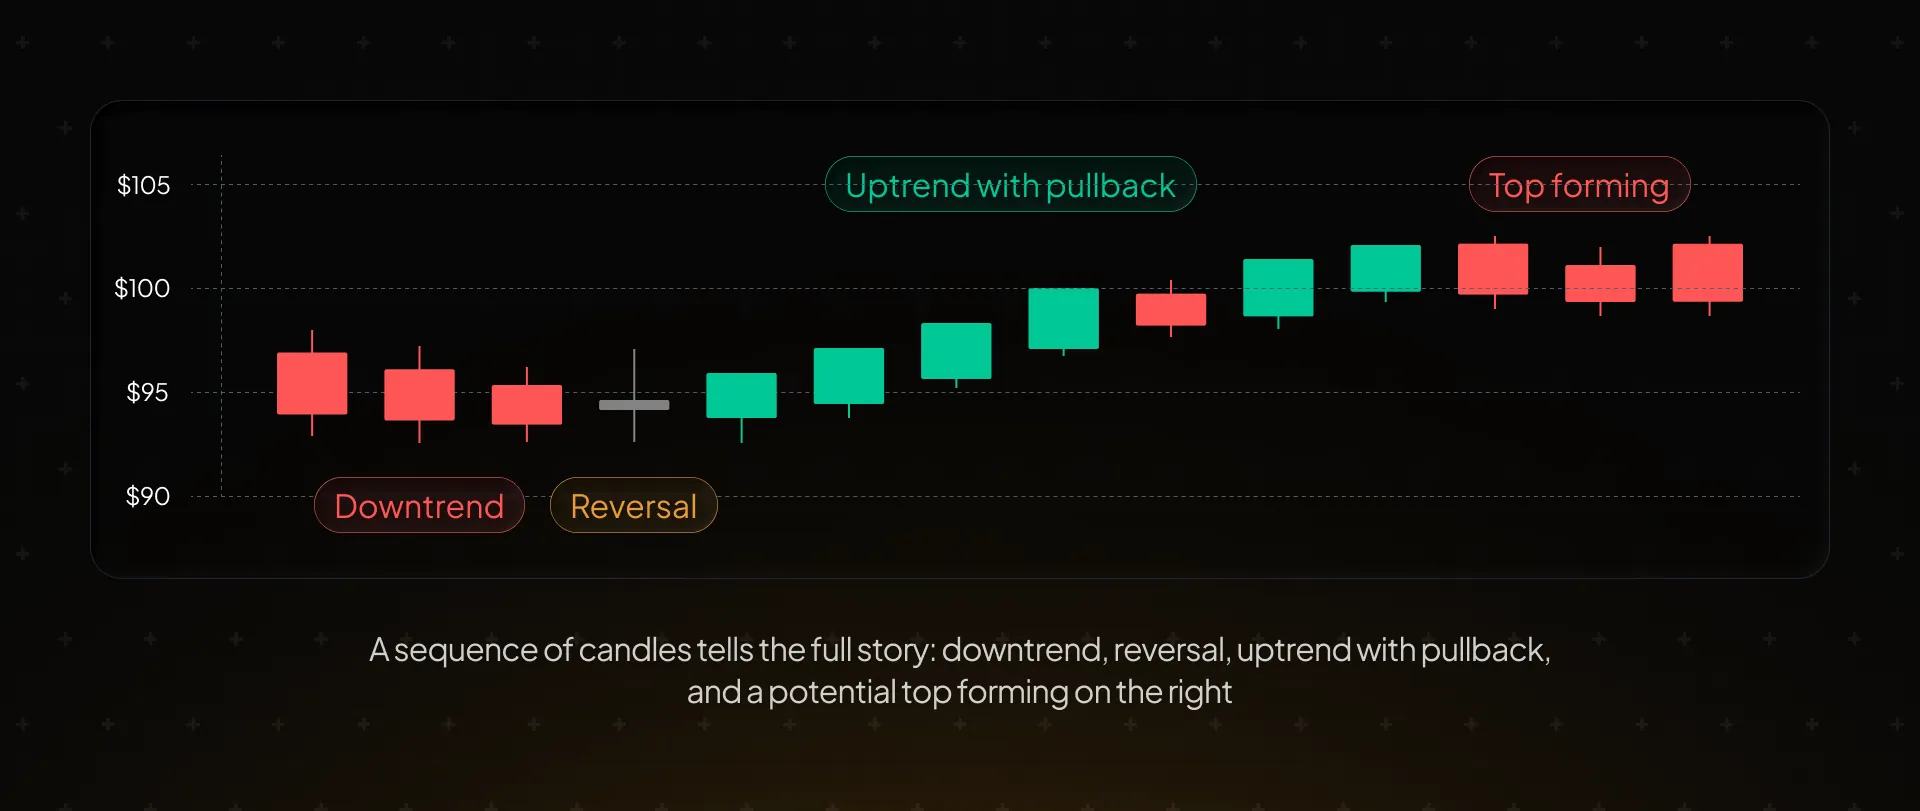
Reading a full candlestick chart
A single candle is one data point. The real power comes from reading candles in context: how they relate to each other, what patterns they form, and what the overall sequence tells you about market sentiment.
Key single-candle patterns
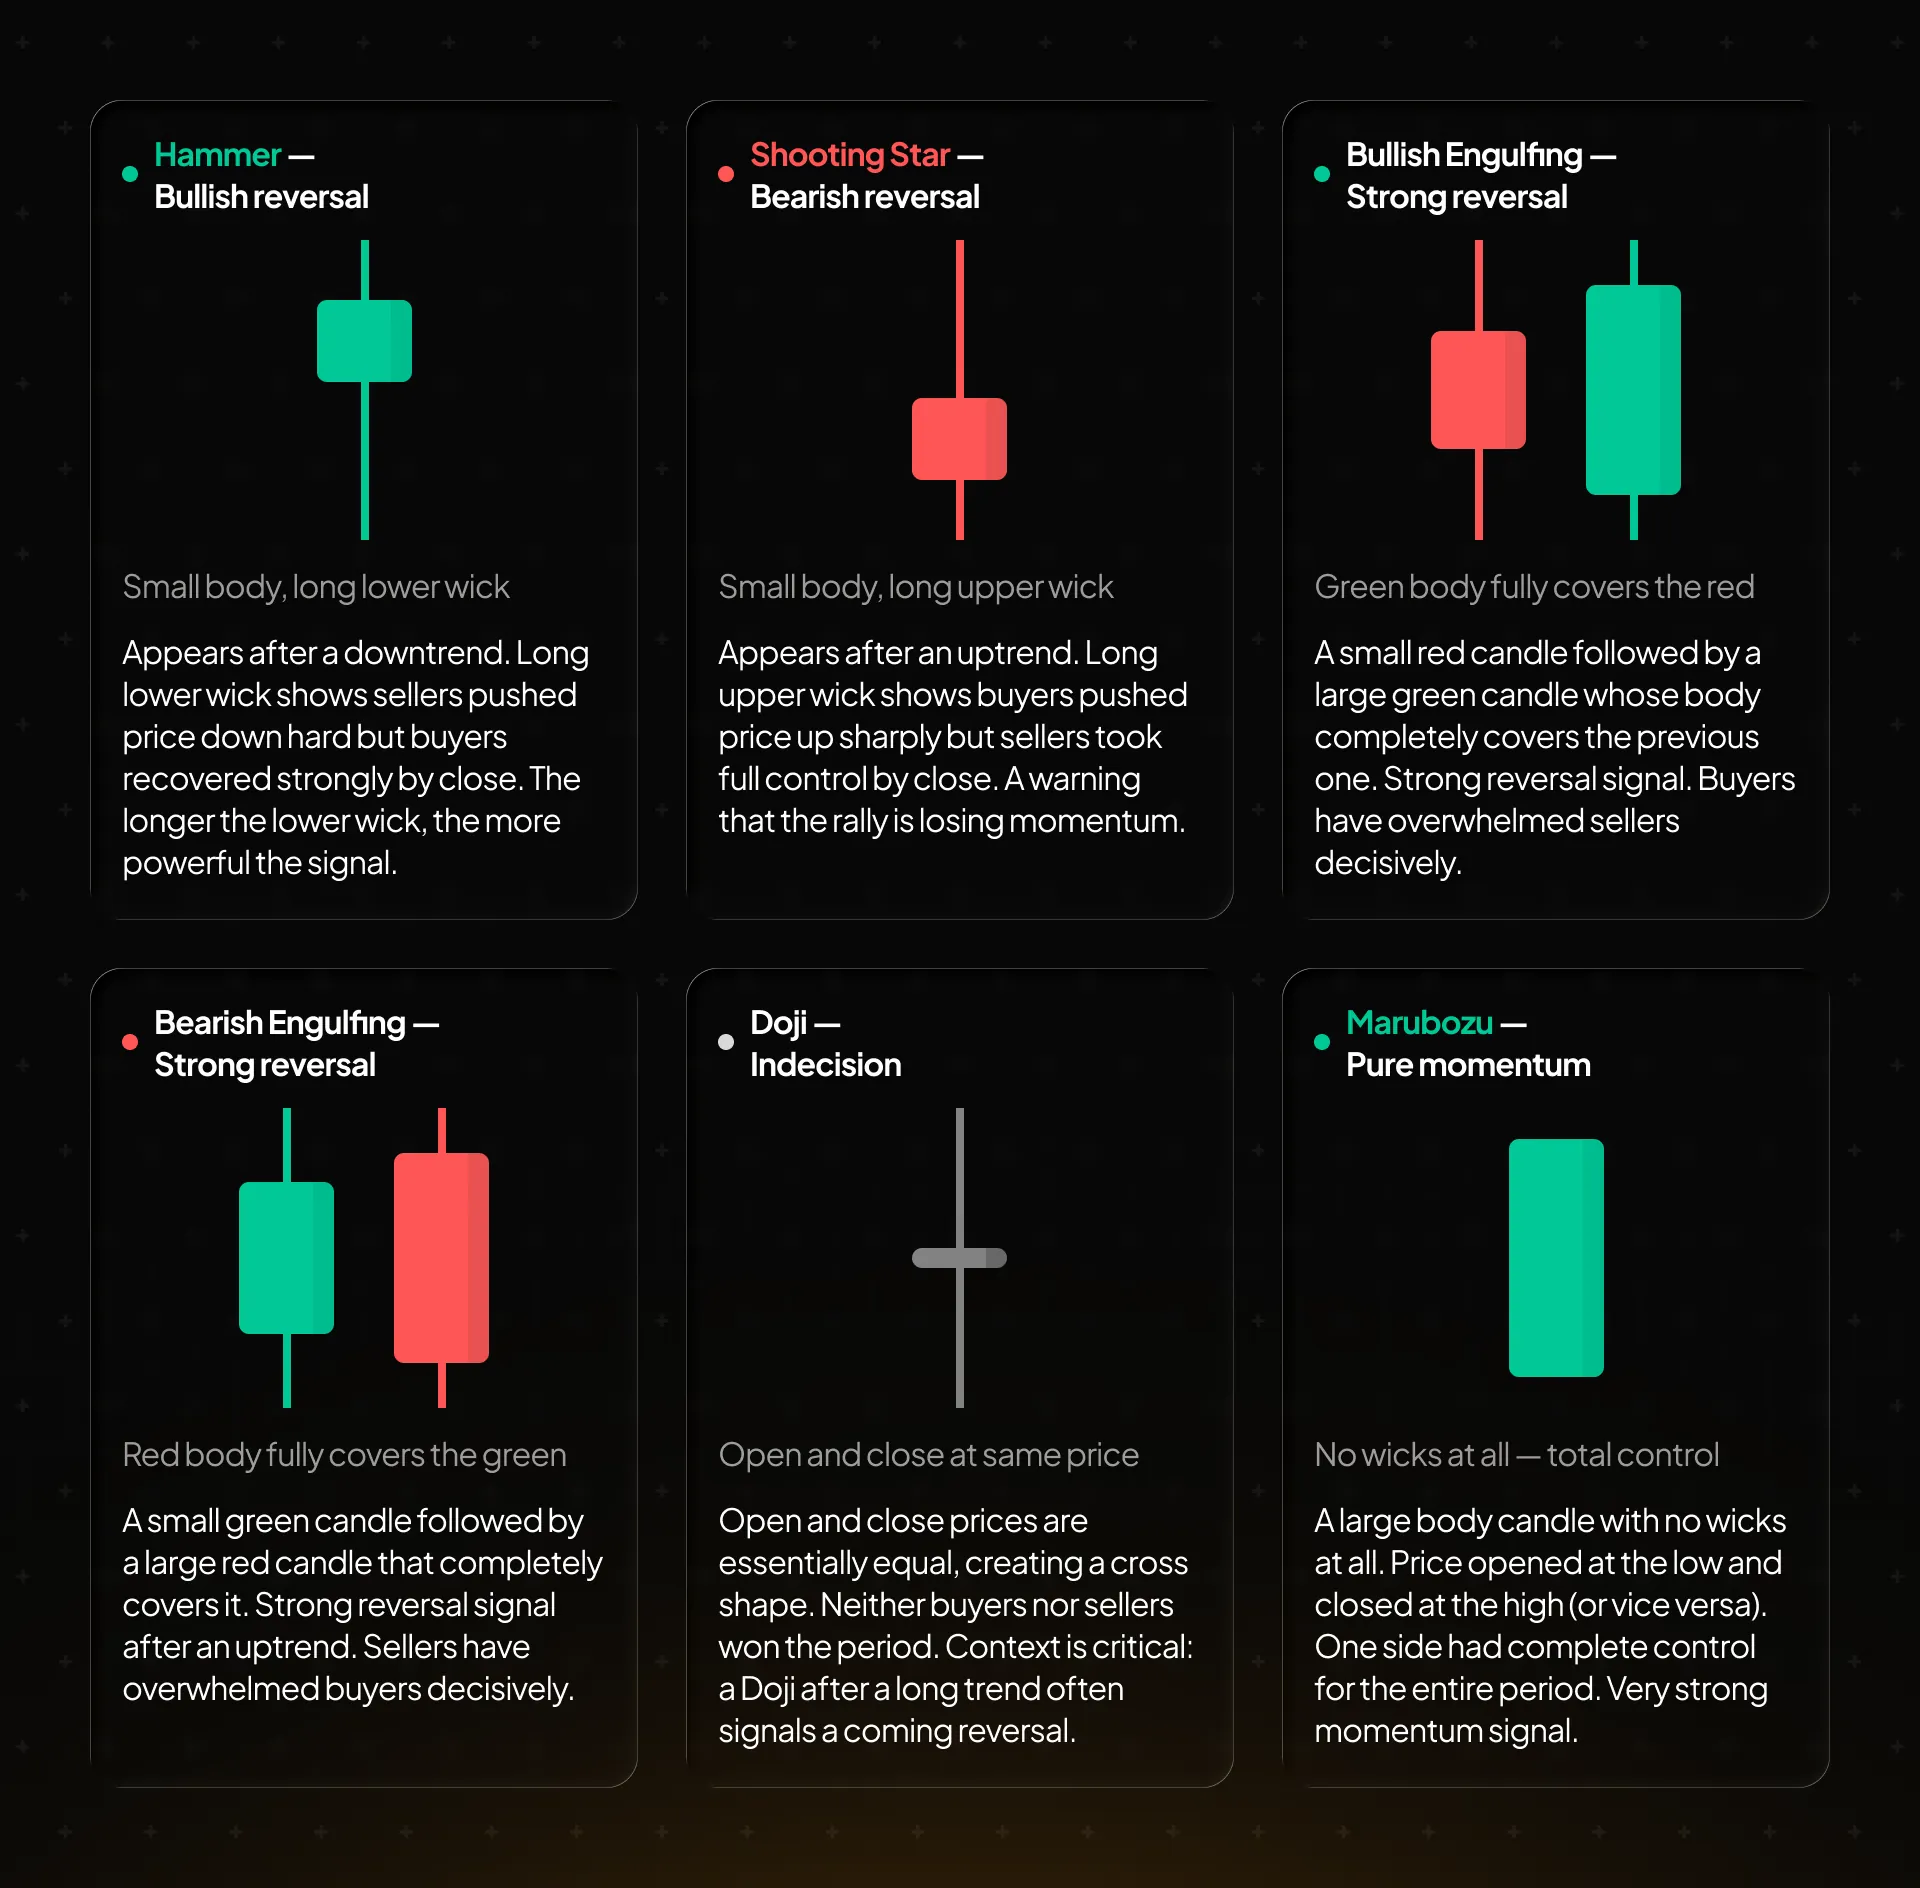
Certain candle shapes appear repeatedly across all markets and carry consistent meaning. These are the most important single-candle patterns every trader should recognize.
Multi-candle patterns
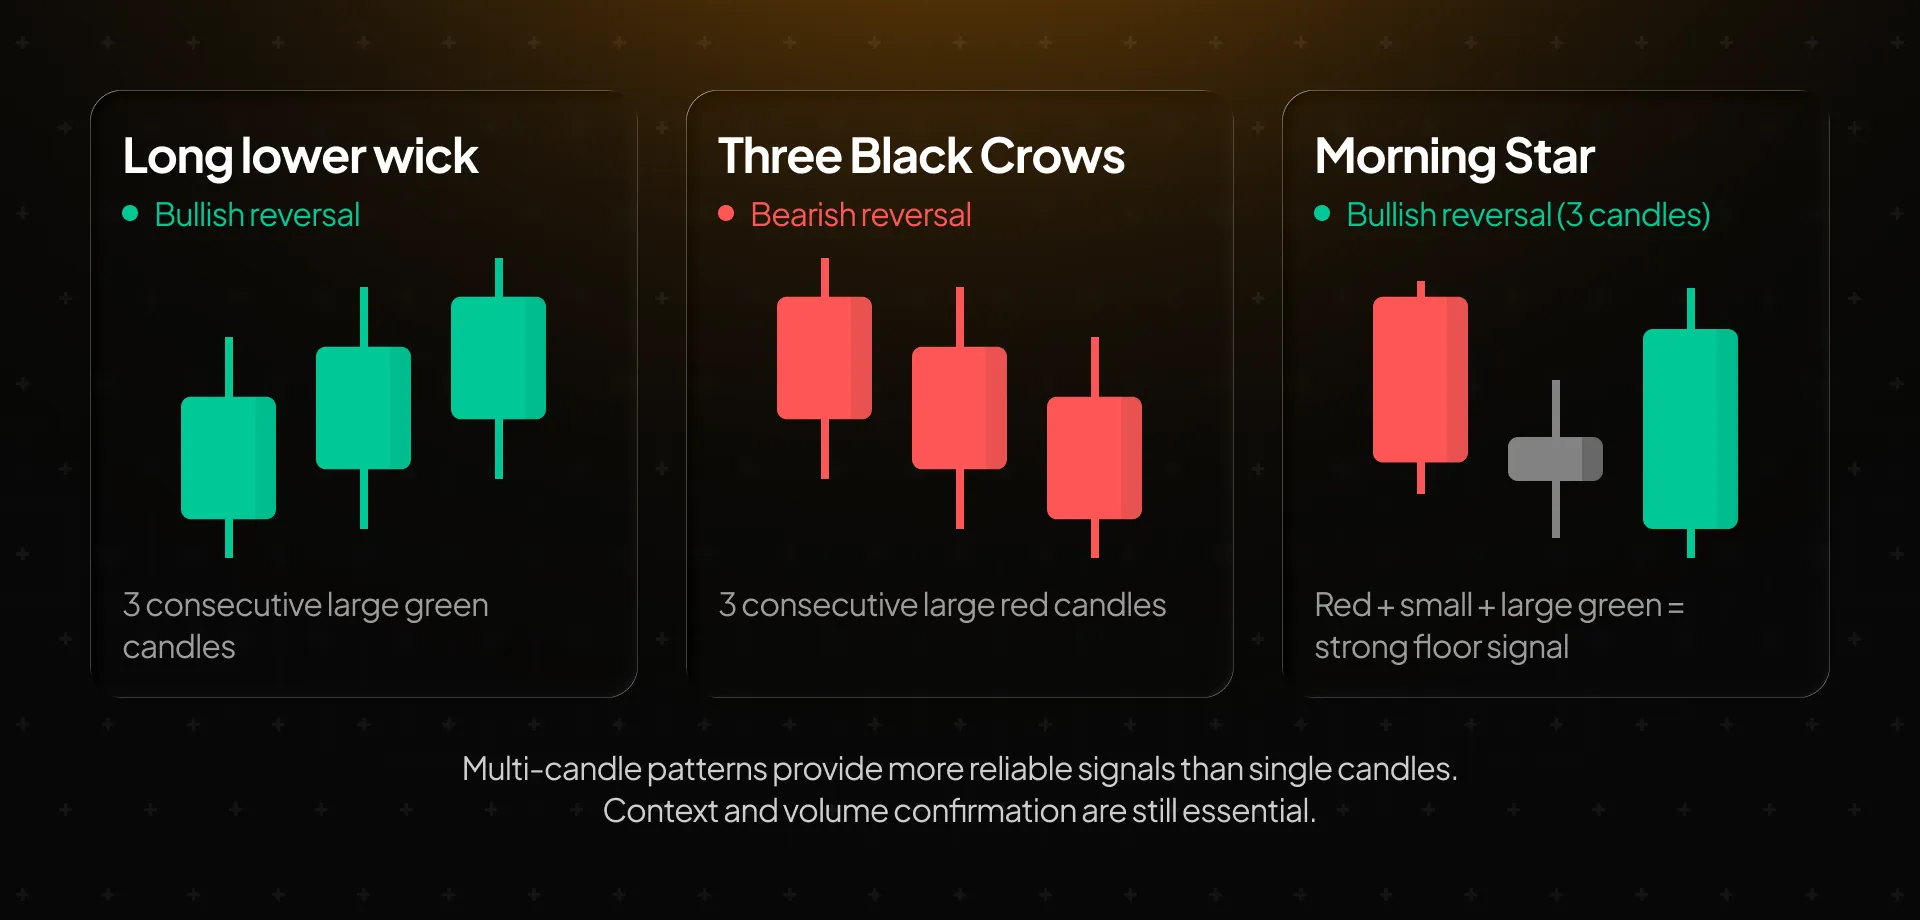
Some of the most reliable signals come not from a single candle but from sequences of two or three candles working together. Here are the most important ones.
How to apply candlestick reading on Canborsa
Whether you are trading tokenized Apple stock, Gold, or a crypto pair on Canborsa, the same candlestick principles apply. Here is a practical framework for using candle reading in real trades.
1. Start with the higher timeframe
Open the daily or 4-hour chart first. Identify the overall trend. Are candles making higher highs and higher lows, or lower highs and lower lows? Never trade without knowing the trend context.
2. Find key levels
Mark where the price has repeatedly bounced or reversed. These are your support and resistance levels. Candlestick patterns at these levels carry far more weight than patterns in open space.
3. Look for reversal signals at levels
A Hammer at support. A Shooting Star at resistance. A Doji after a long run. These are the setups with the highest probability. Wait for the candle to close before acting.
4. Confirm with volume
A bullish reversal candle on high volume is far more reliable than the same pattern on thin volume. Volume confirmation separates real moves from noise.
5. Define risk before entering
Identify your stop loss level before the trade. For a bullish setup, the stop typically goes below the low of the signal candle. Never enter without knowing exactly where you are wrong.
6. Wait for the candle to close
A candle can look like a Hammer mid-formation and close as a Doji. Patterns are only valid on the closed candle. Acting on an open candle is one of the most common beginner mistakes.
No candlestick pattern works in isolation. A Hammer in a strong downtrend with no nearby support and low volume is not a reliable signal. Always combine candle reading with trend context, key levels, and volume.
Key takeaways
- Every candlestick shows four data points: open, high, low, and close. Together they tell the complete story of buyer and seller activity in that time period.
- A green candle means price closed above the open (buyers won). A red candle means price closed below the open (sellers won).
- Wicks reveal where the market was rejected. A long lower wick is bullish (buyers absorbed selling). A long upper wick is bearish (sellers absorbed buying).
- Key single-candle patterns: Hammer (bullish reversal), Shooting Star (bearish reversal), Doji (indecision), Marubozu (pure momentum), Engulfing (strong reversal).
- Multi-candle patterns like Three White Soldiers, Three Black Crows, and Morning Star provide stronger signals than single candles.
- Always wait for the candle to close before acting. Always confirm with volume. Always read candles in the context of trend and key levels.
- These patterns work on every market you trade on Canborsa: tokenized stocks, commodities, crypto, and perpetual contracts.