What Is Technical Analysis?
Canborsa Team
Whether you are trading SpaceX stock, gold futures, or crypto on Canborsa, price moves in patterns. And those patterns can be read. Technical analysis is the skill of reading them. It does not predict the future with certainty. But it gives you a structured, evidence-based framework for making better decisions in any market.
What is technical analysis?
Technical analysis (TA) is the practice of studying historical price data, volume, and chart patterns to forecast the future direction of an asset's price. It works on stocks, forex, commodities, crypto, and tokenized RWAs because it does not analyze the asset itself. It analyzes human behavior.
Fear, greed, panic selling, euphoric buying: these patterns repeat across every market in history because human psychology does not change. That is why the same tools used by rice traders in 18th-century Japan are still used by professional traders today.
Use fundamental analysis to decide what to buy. Use technical analysis to decide when to buy it. The two approaches work best together.
Reading a candlestick chart
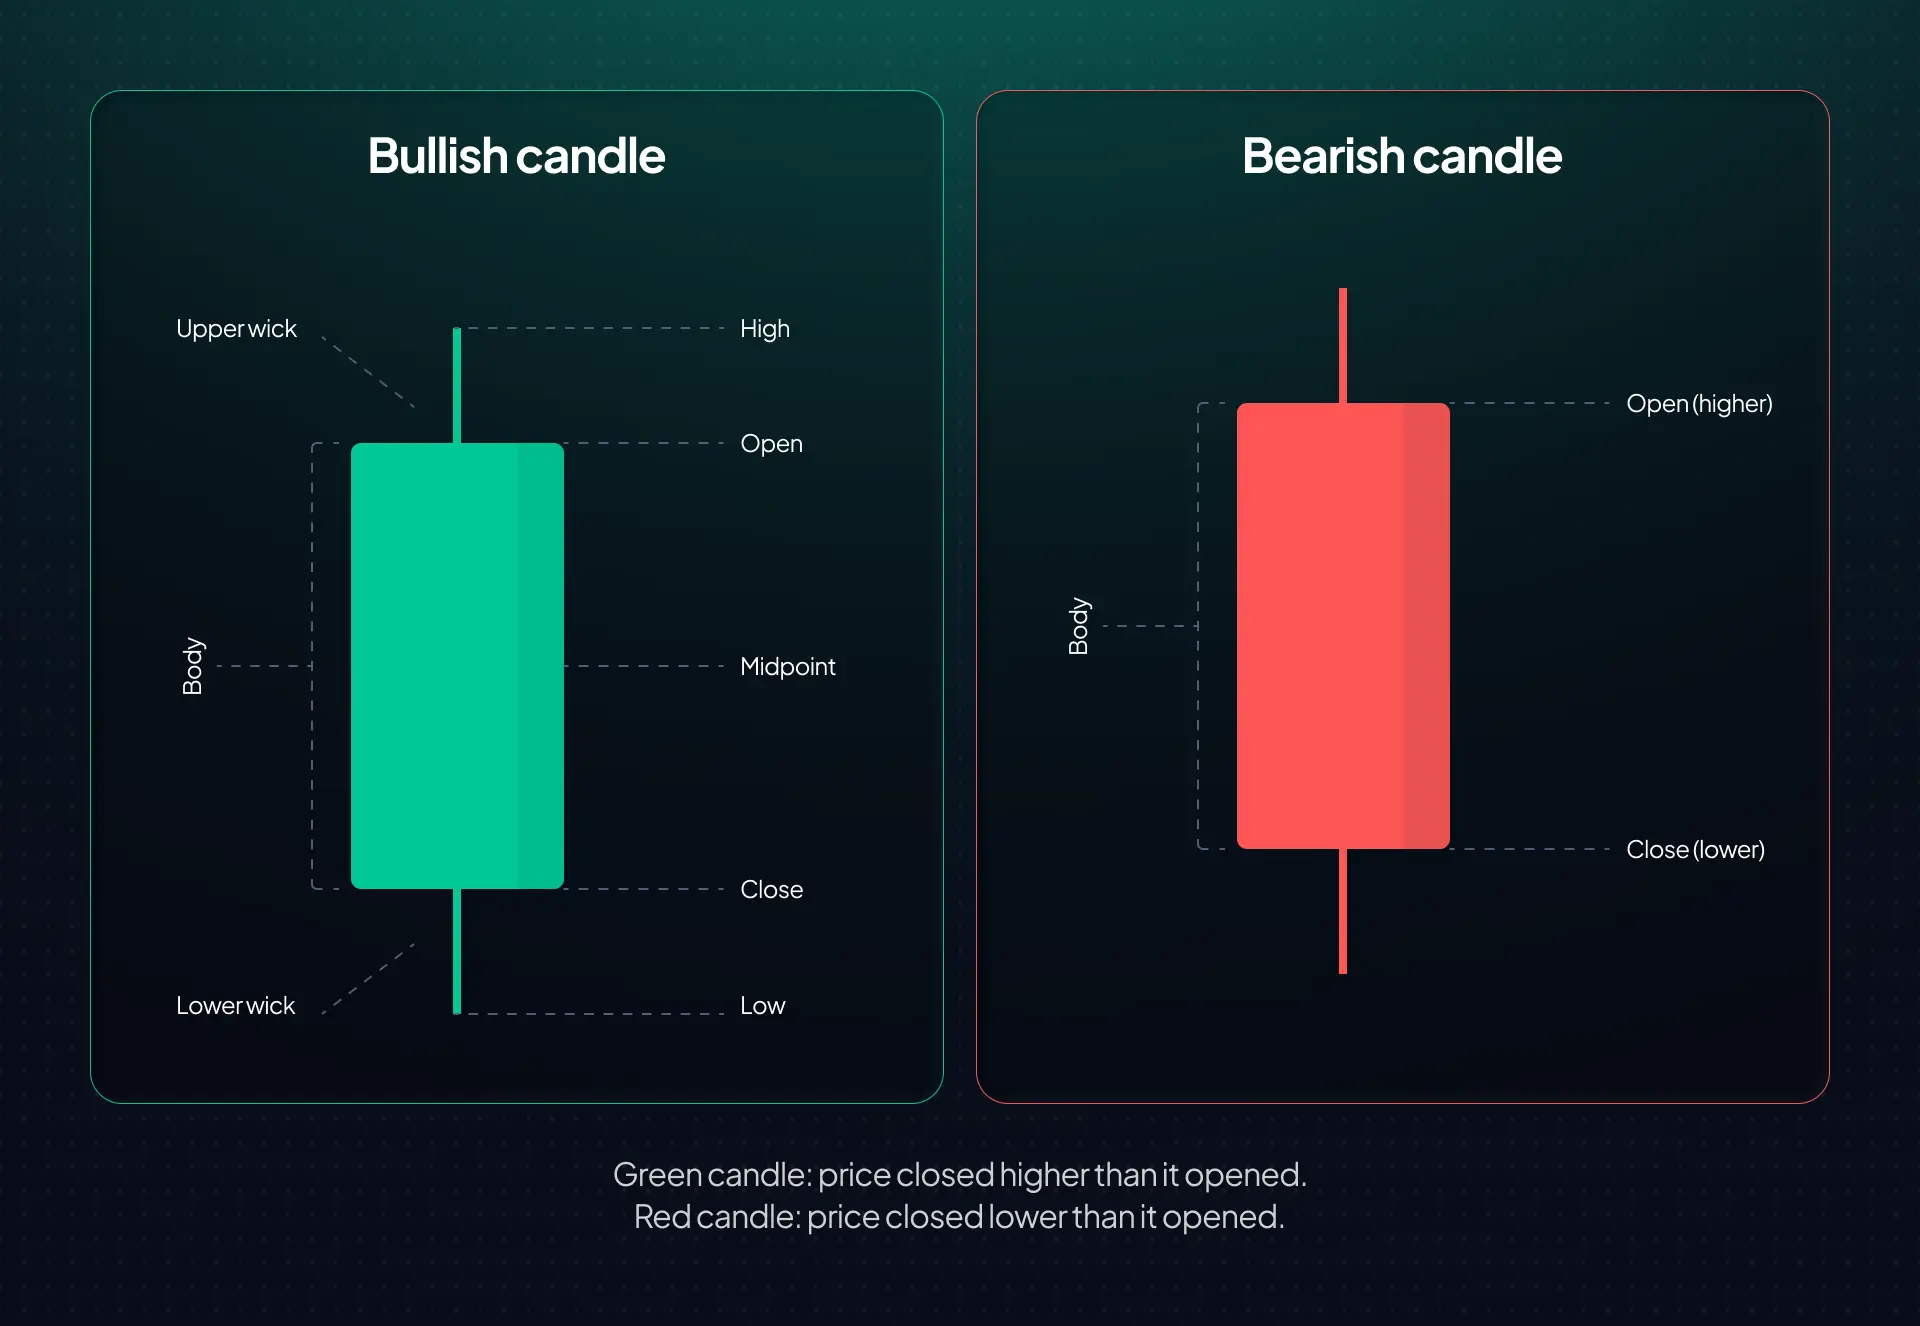
The candlestick is the building block of every price chart. Each candle represents price movement over a fixed time period, whether that is 1 minute, 1 hour, or 1 day. Every candle contains exactly four pieces of information.
Timeframes
Every chart has a timeframe. The same asset looks completely different on a 5-minute chart versus a weekly chart. Use shorter timeframes for entries and exits, and longer timeframes for overall trend context.
Day traders typically work with 1-minute, 5-minute, and 15-minute charts, using them for short-term entries and scalping. Swing traders prefer the 1-hour and 4-hour timeframes to identify medium-term trends. Position traders and long-term investors rely on daily and weekly charts to track major trends and key price levels.
The most important concept: trend
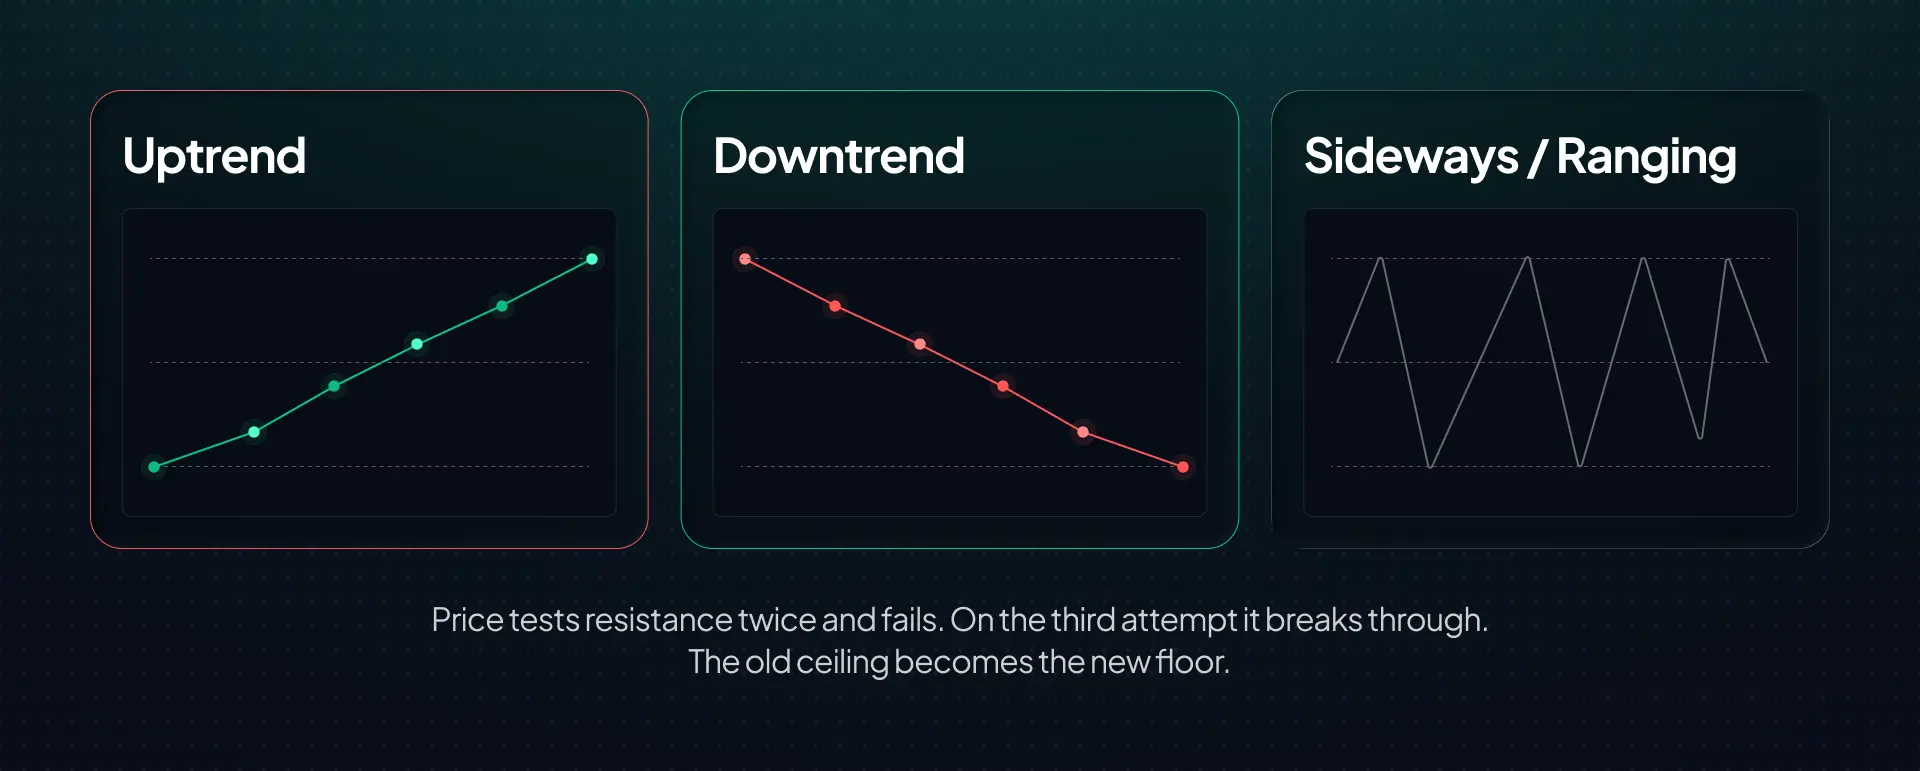
Before applying any indicator, ask one question first: what is the trend? Trading in the direction of the trend is the single most reliable edge in all of technical analysis.
Support and resistance
Support and resistance are the two most fundamental concepts in all of technical analysis. They appear in every market and every timeframe.
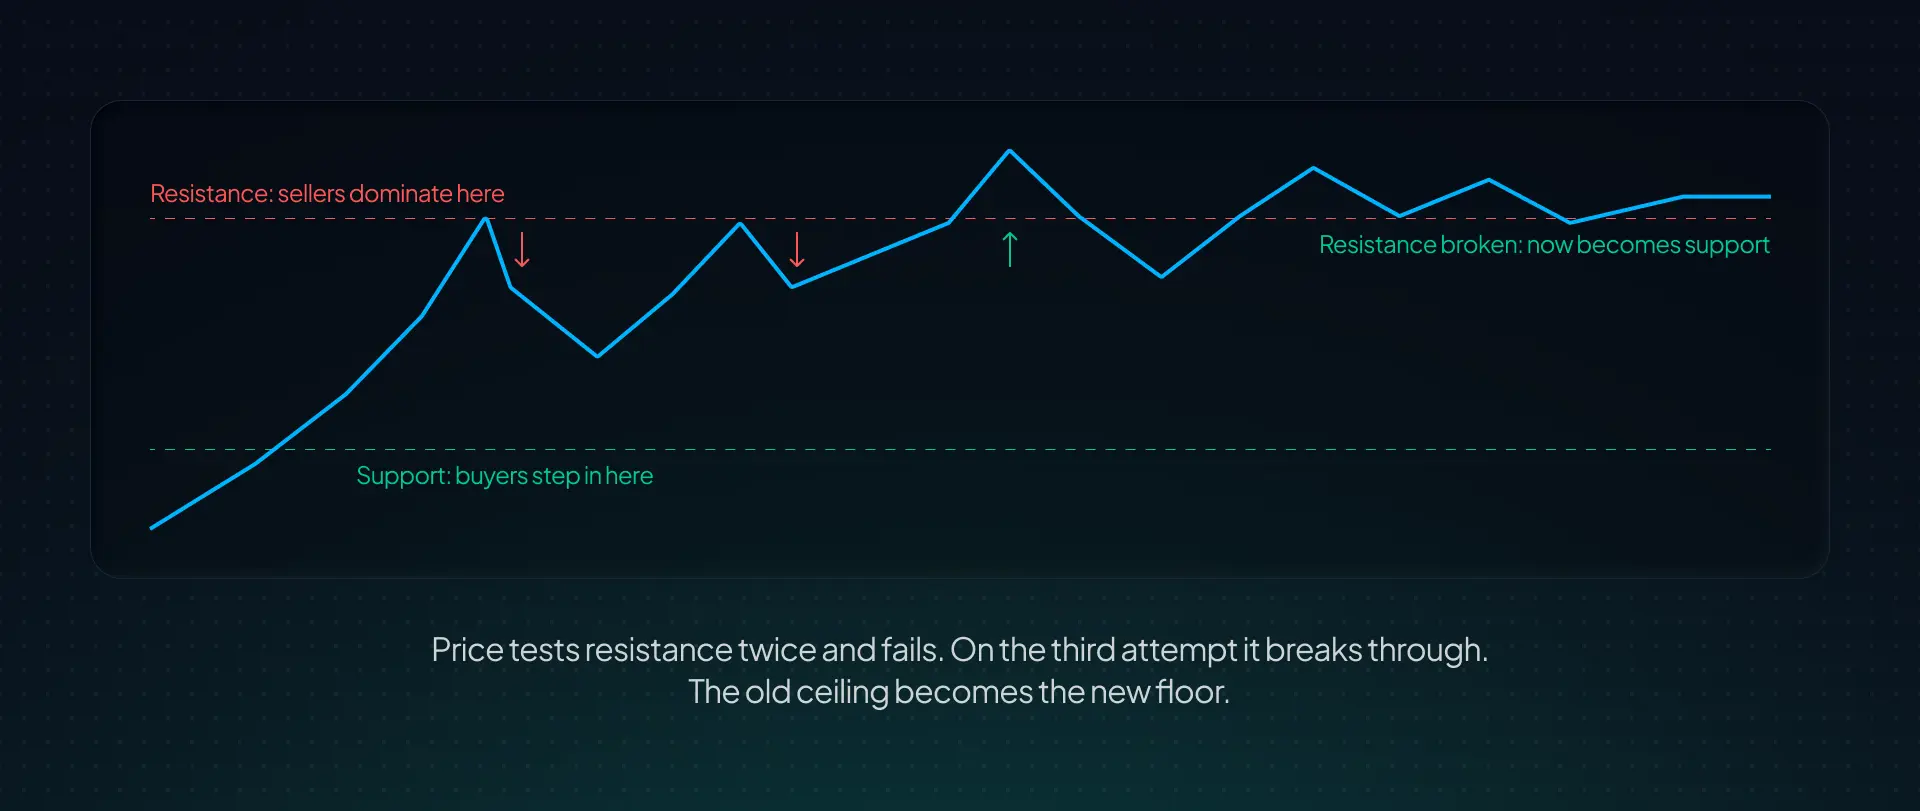
Support is a price level where buying pressure has historically stopped a decline. Think of it as a floor. Resistance is a price level where selling pressure has historically stopped a rally. Think of it as a ceiling.
One of the most important rules in TA: when a resistance level is broken convincingly, it often becomes new support. This is called a role reversal and is one of the most reliable and tradeable patterns in any market.
The four core indicators
Indicators are mathematical calculations applied to price data. They help identify momentum, trend direction, and potential reversal points. Start with these four before adding anything else to your charts.
1. Moving averages
A moving average smooths out price data to reveal the underlying trend by filtering out short-term noise.
SMA (Simple Moving Average): The average closing price over N periods. Equal weight given to every candle. Slower to react. Common settings: 50 SMA and 200 SMA for trend context.
EMA (Exponential Moving Average): Gives more weight to recent prices. Reacts faster to price changes. Better for active trading. Common settings: 9 EMA, 20 EMA, 50 EMA.
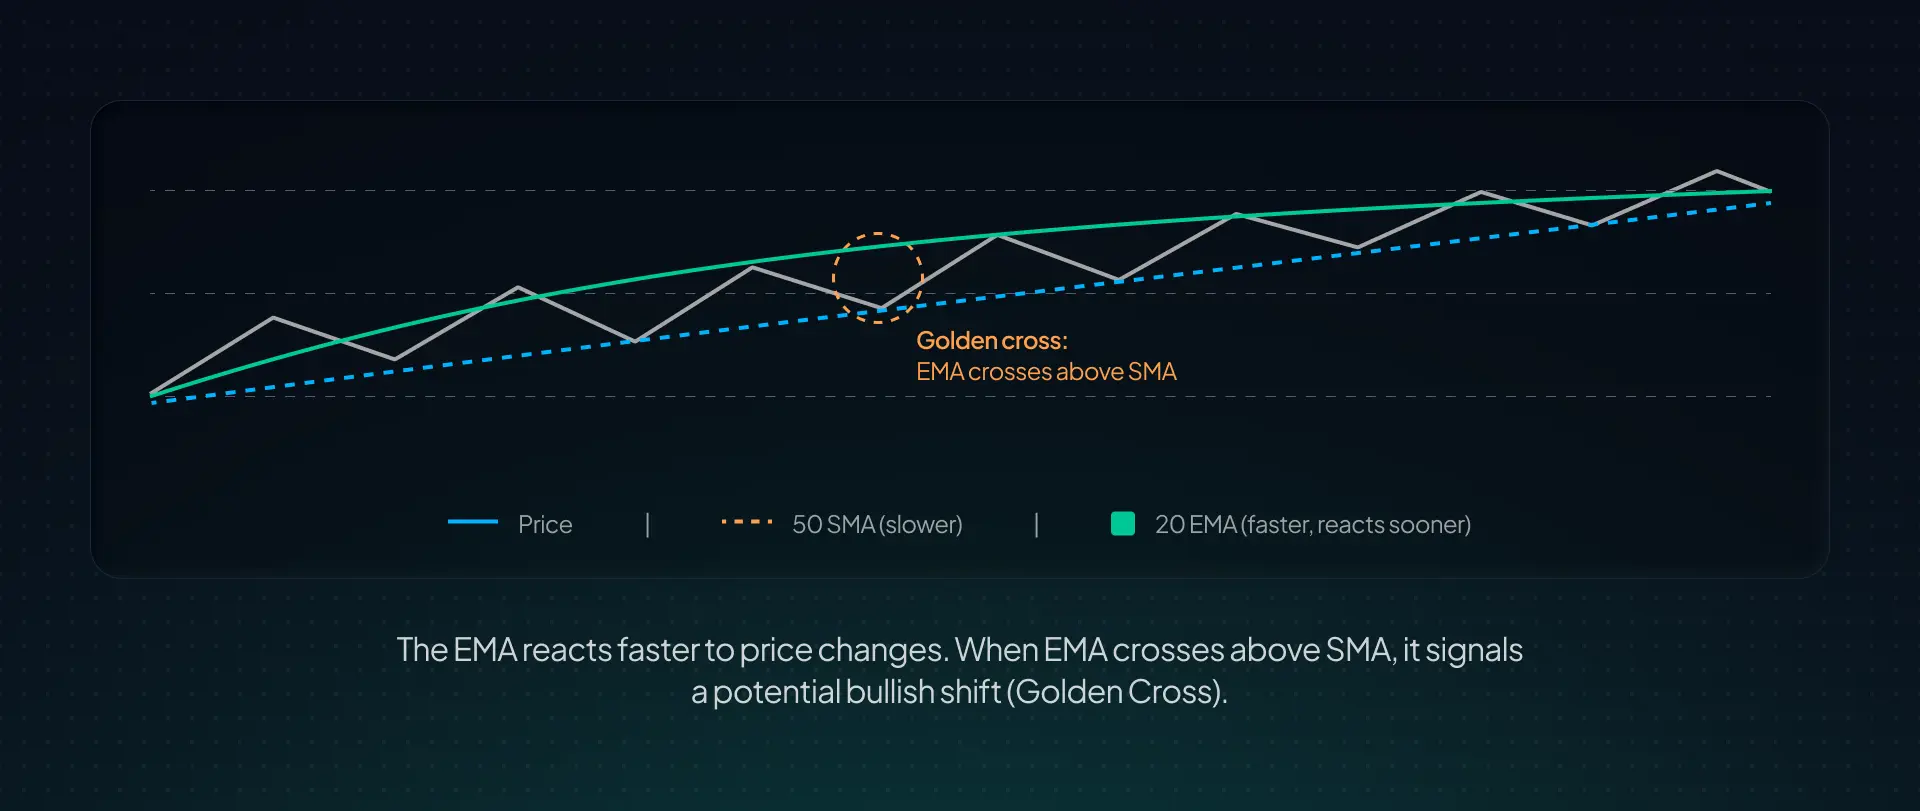
Golden Cross: 50-day MA crosses above 200-day MA — bullish signal. Death Cross: 50-day MA crosses below 200-day MA — bearish signal. Both are widely watched by institutional traders in stocks and crypto.
2. RSI (Relative Strength Index)
RSI measures the speed and magnitude of price changes on a scale of 0 to 100. It is one of the most widely used indicators across stocks, forex, and crypto.
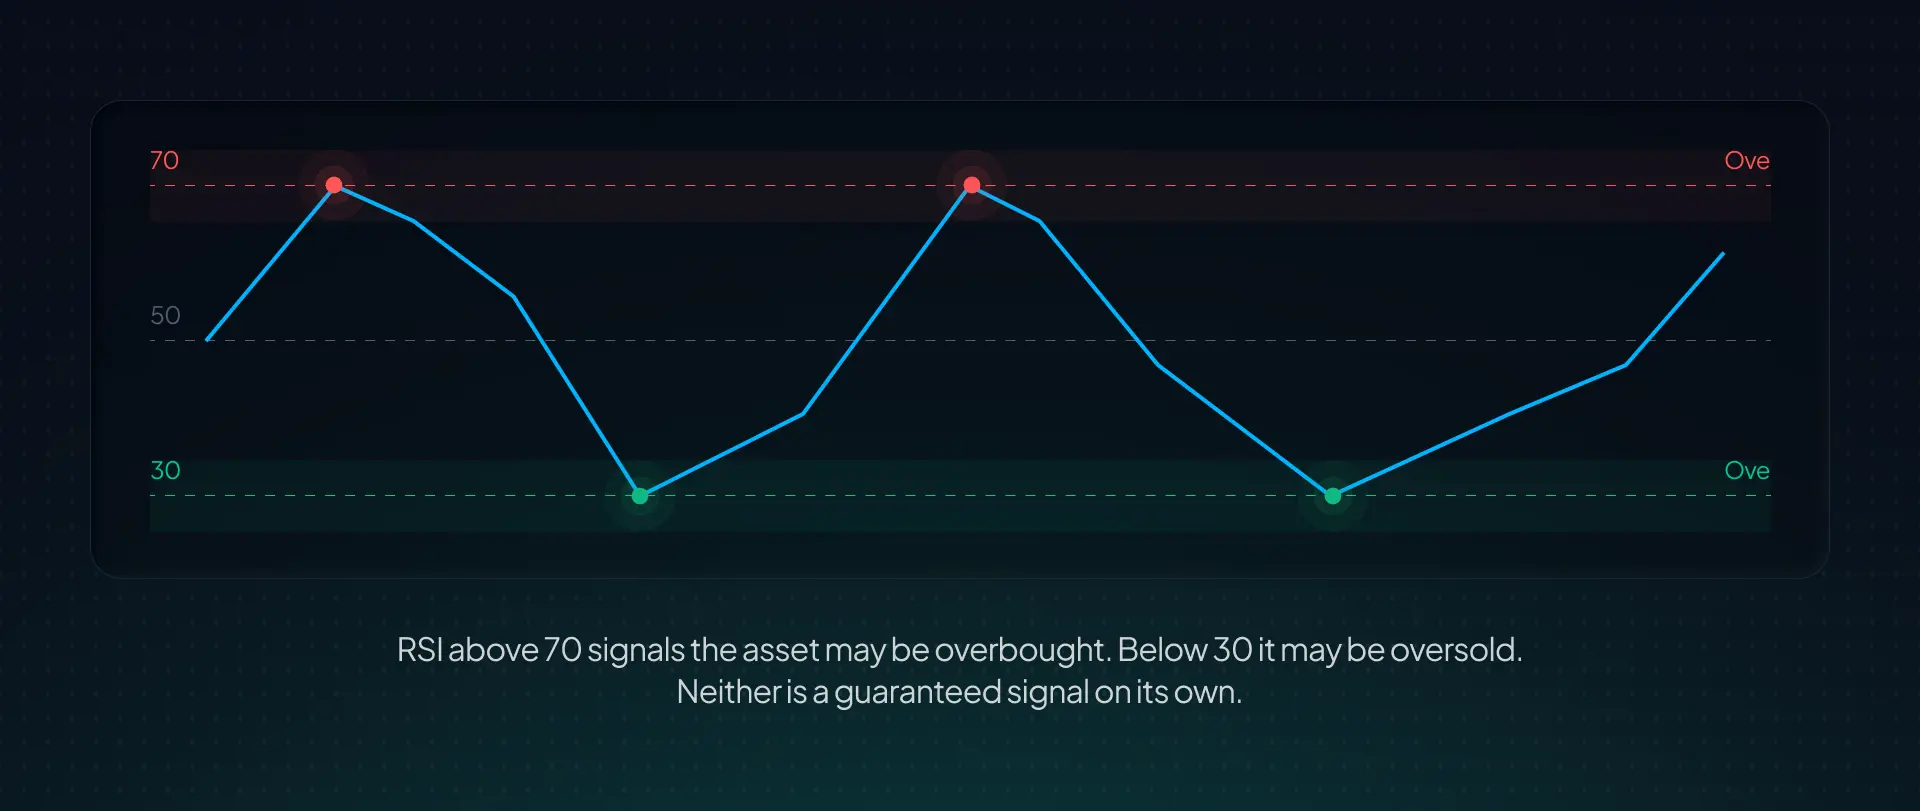
When RSI climbs above 70, the asset is potentially overbought. This is a signal to look for reversal signs, but do not short blindly as strong trends can stay above 70 for extended periods.
Between 50 and 70, momentum is bullish. The trend is likely up, so look for entries on pullbacks rather than chasing price.
Between 30 and 50, momentum is turning bearish. The trend is likely down or weakening, so be cautious with long positions.
When RSI drops below 30, the asset is potentially oversold. Again, look for reversal signals before acting, and do not buy blindly as assets in a downtrend can stay oversold for a long time.
3. MACD (Moving Average Convergence Divergence)
MACD shows the relationship between two EMAs (typically the 12-period and 26-period). It consists of three elements: the MACD line, the signal line, and the histogram.
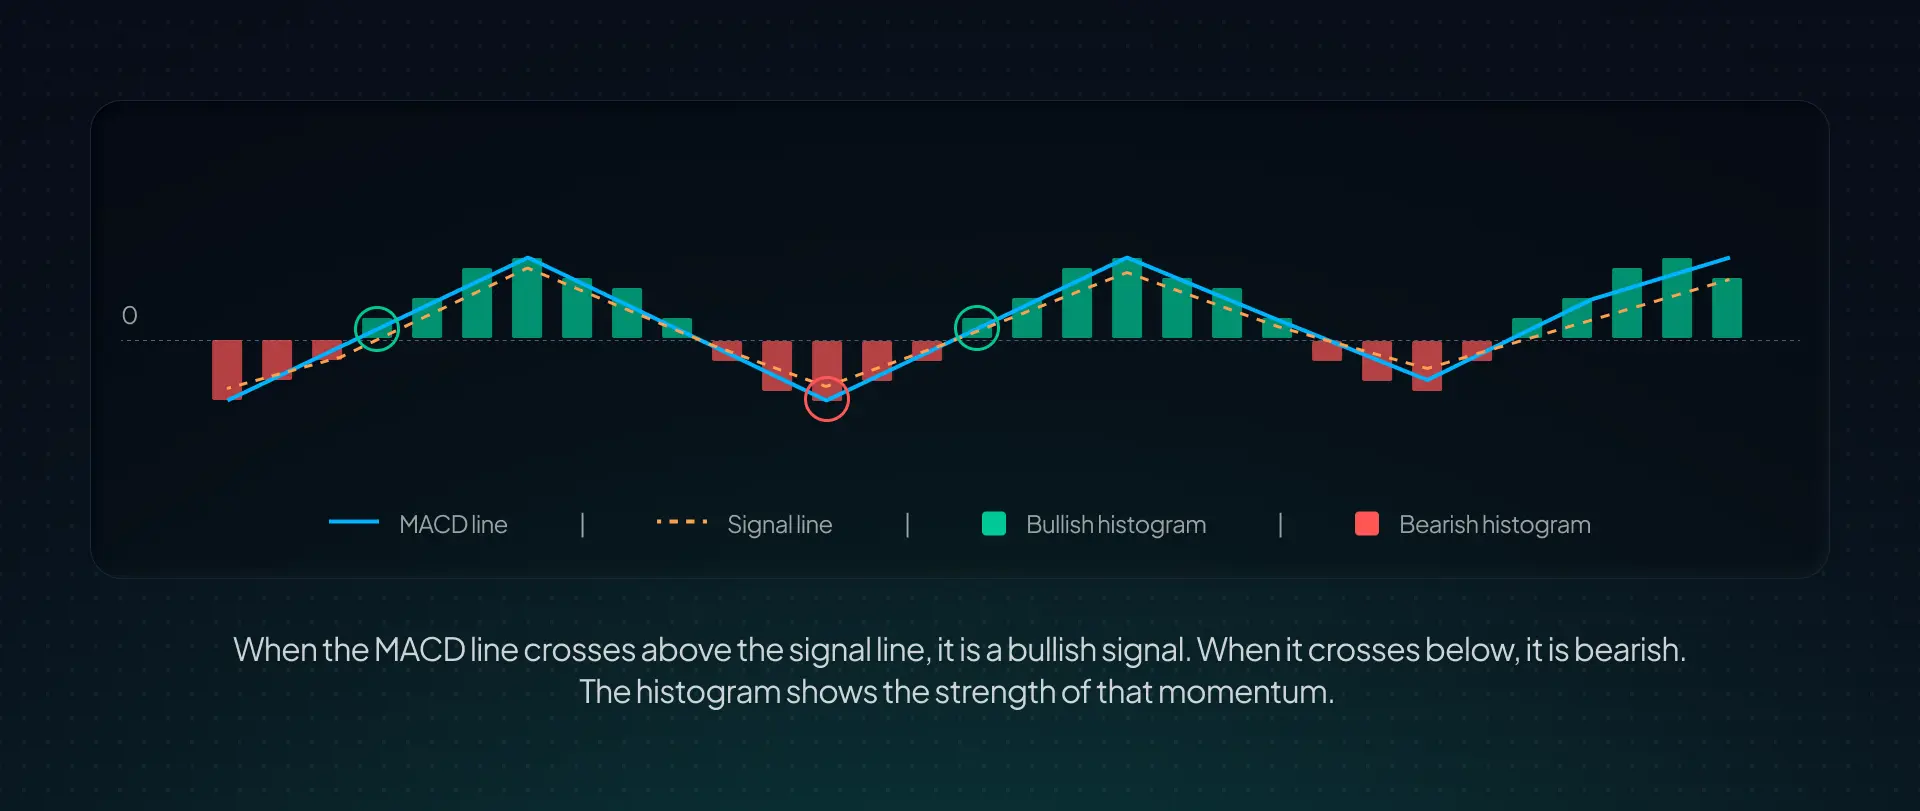
4. Volume
Volume is the total number of units traded in a given period. It is not technically an indicator but it is essential. A price move on high volume carries conviction. The same move on low volume is suspect and more likely to reverse.
High volume breakout: price breaks above resistance on high volume. Strong signal. Buyers are committed. The move is more likely to continue.
Low volume breakout: price breaks above resistance on thin volume. Weak signal. The move may be a fake-out. Wait for volume confirmation before entering.
Common chart patterns
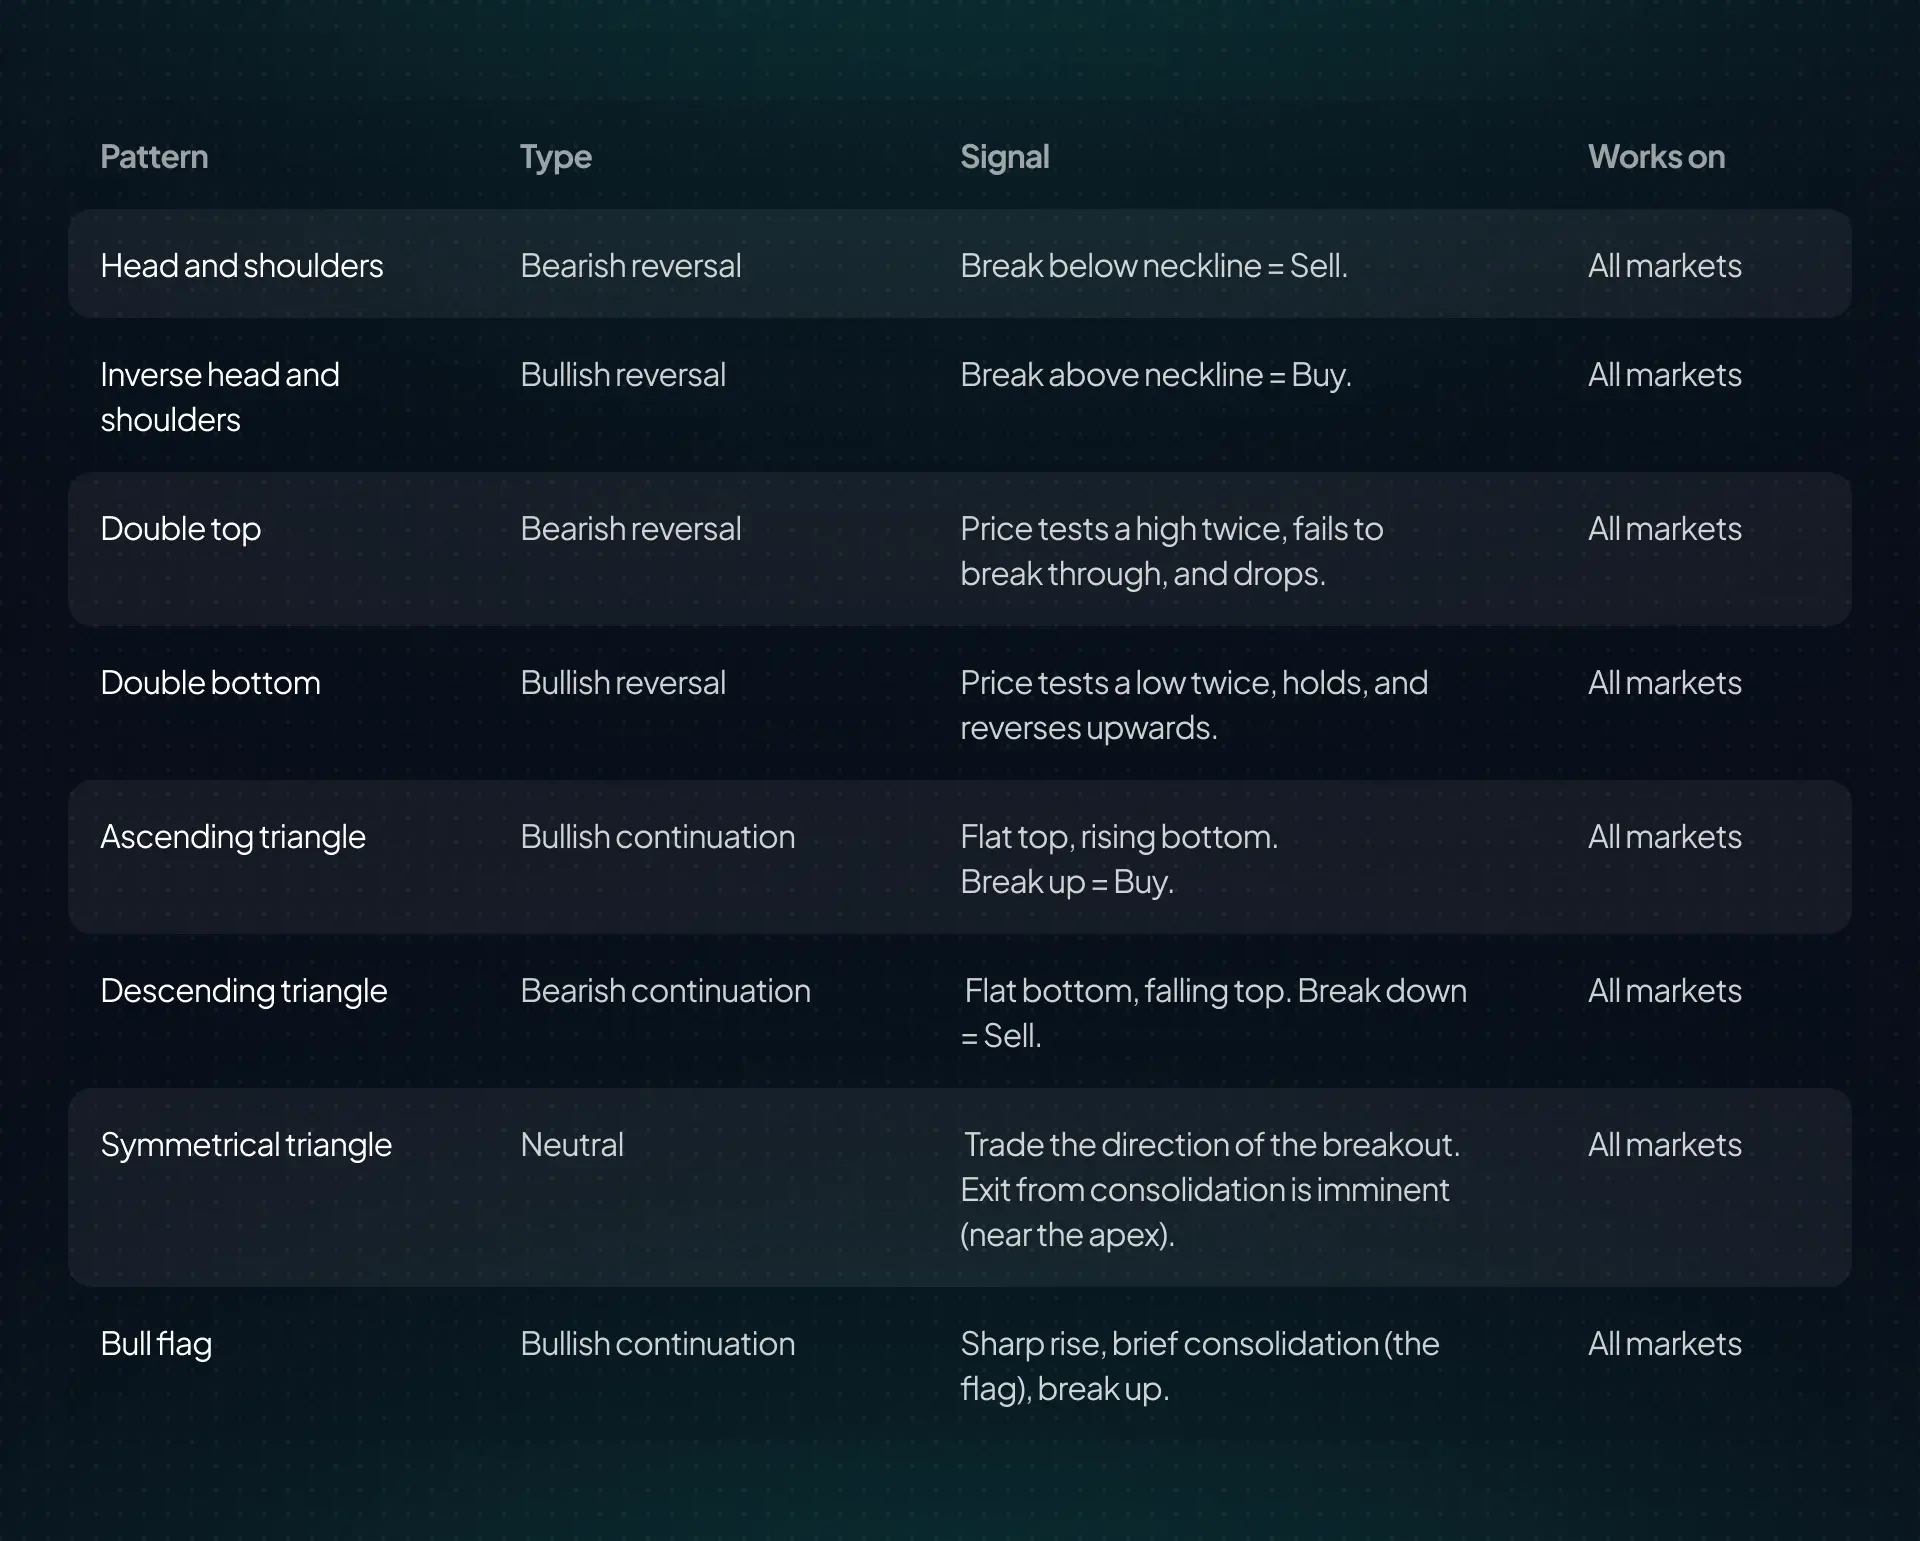
Beyond indicators, price itself forms recognizable shapes called chart patterns. They work because the same human behaviors (fear, greed, indecision) leave the same fingerprints on charts across all markets and all timeframes.
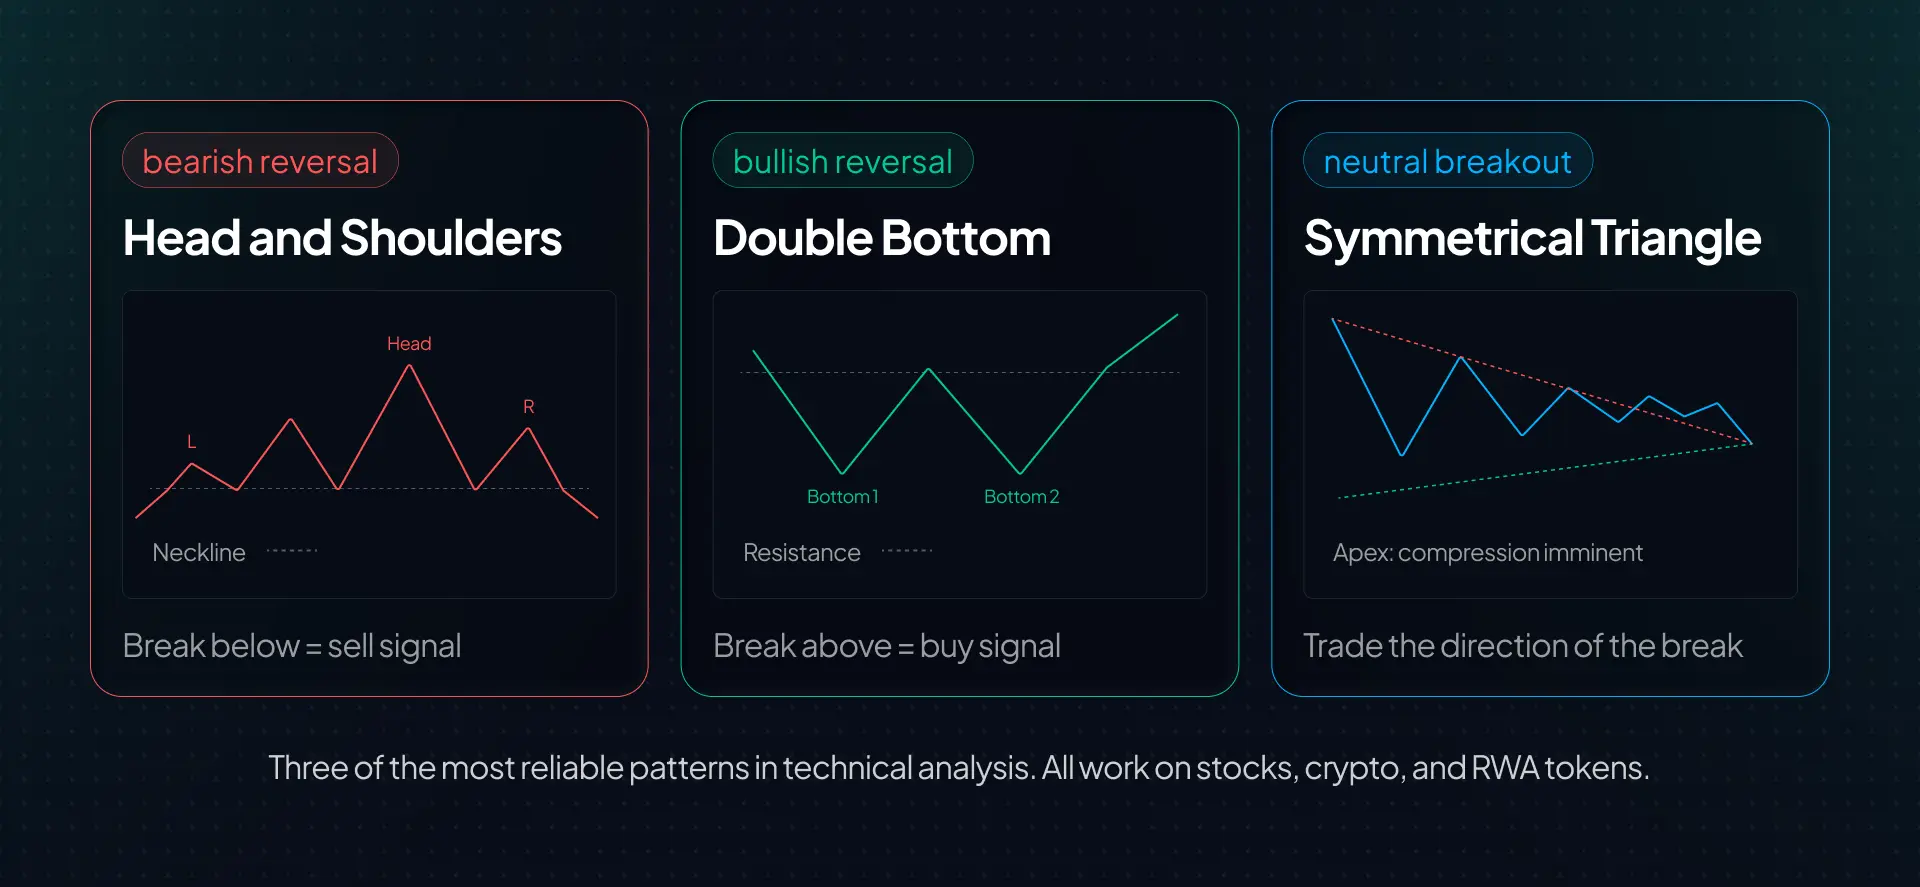
Why TA works across stocks, crypto, and RWAs
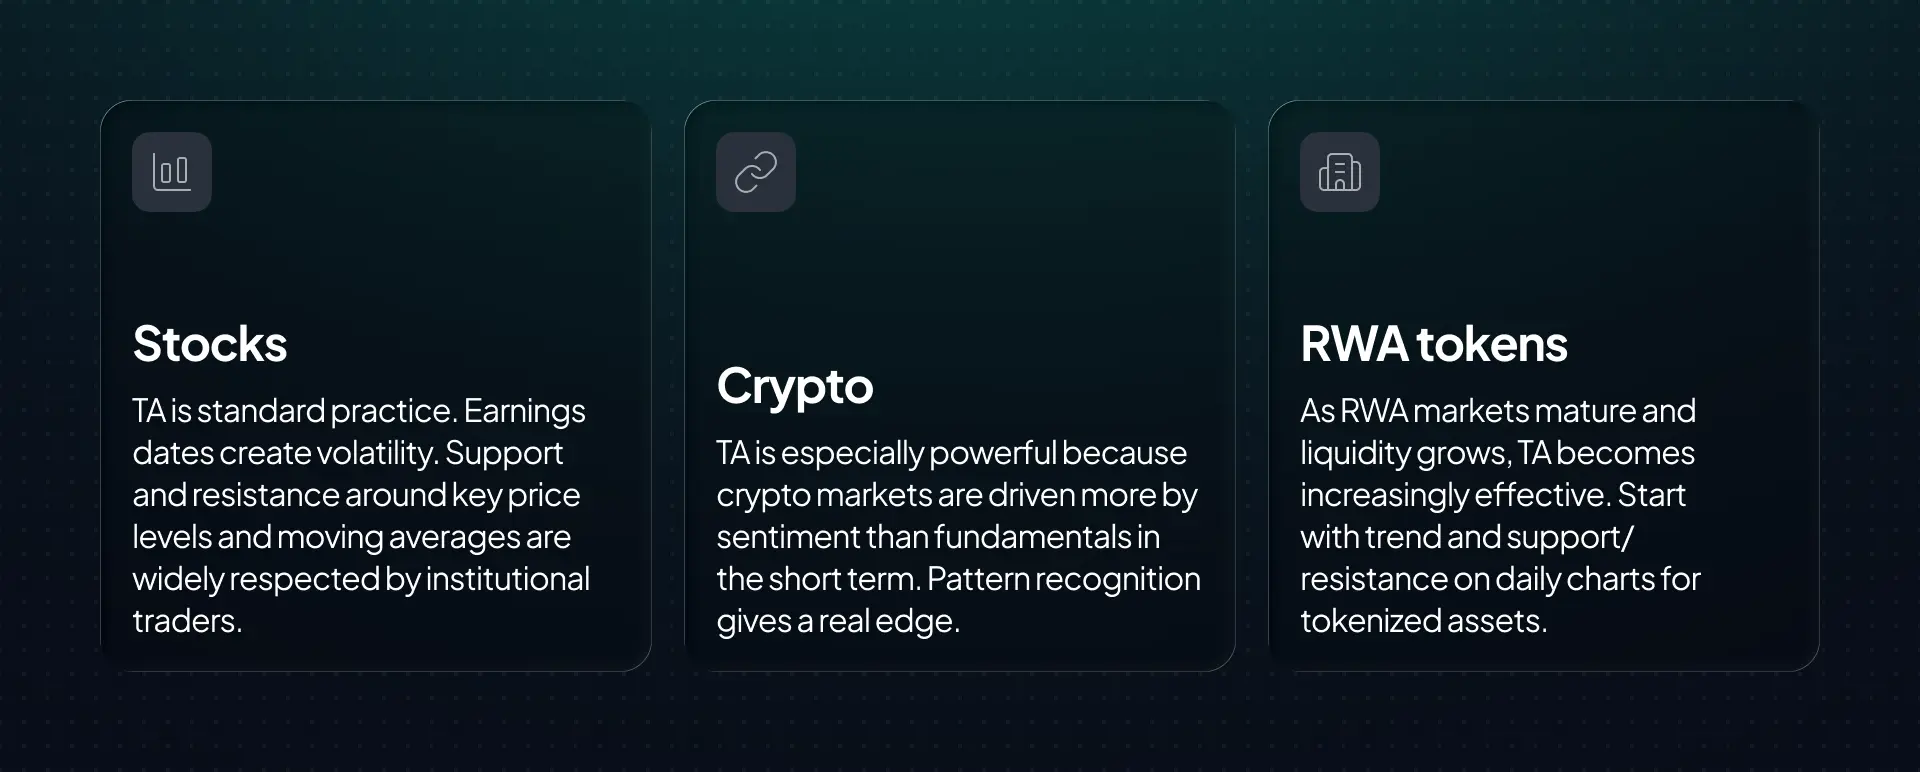
You can put a Tesla stock chart and a Bitcoin chart side by side and apply identical tools. Support levels hold. RSI signals appear. Chart patterns form in the same way. That is because TA is not analyzing the asset. It is analyzing the traders behind it.
Fear causes the same panic selling pattern in Apple stock as it does in ETH. Greed creates the same euphoric blowoff tops in gold as it does in a tokenized property token on Canborsa. The psychology is constant. The charts reflect it.
Key takeaways
- Technical analysis studies price charts and data to forecast future price direction. It works on stocks, crypto, forex, and tokenized RWA tokens because it analyzes human behavior, not the asset itself.
- The candlestick is the building block of every chart. Each candle shows four things: open, high, low, and close. Green means price rose. Red means it fell.
- Always identify the trend first: uptrend (higher highs and higher lows), downtrend (lower highs and lower lows), or sideways (range-bound). Trade with the trend, not against it.
- Support and resistance are the most fundamental TA concepts. When resistance breaks, it often becomes new support.
- Start with four core indicators: Moving Averages (trend), RSI (momentum), MACD (momentum crossovers), and Volume (confirmation).
- Chart patterns repeat across all markets. Head and shoulders, double tops/bottoms, triangles, and flags all signal potential price moves.
- TA is a probability tool. Combine it with fundamental analysis and always manage risk with stop losses and position sizing.